We are at 6 weeks. Week 6 has been a week in which I his a bit of a plateau. I did not take any days off and that is three weeks in a row without a day off.
Exercise: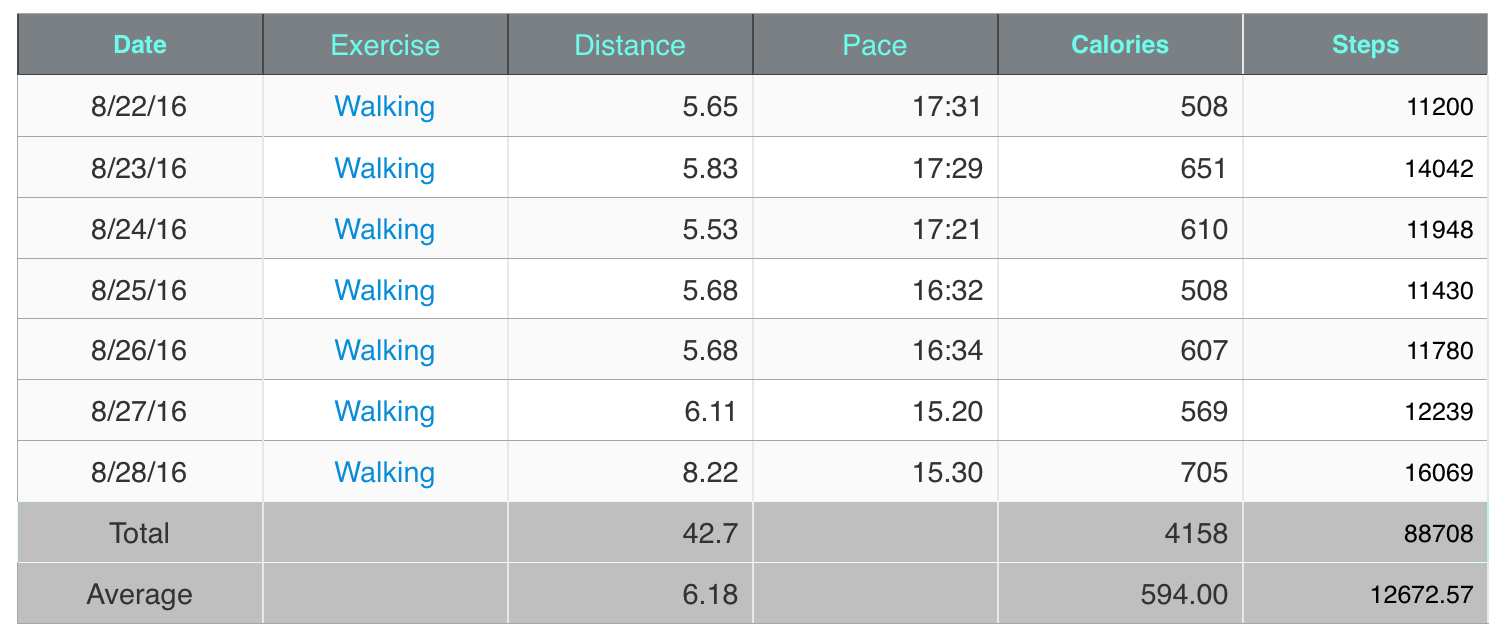
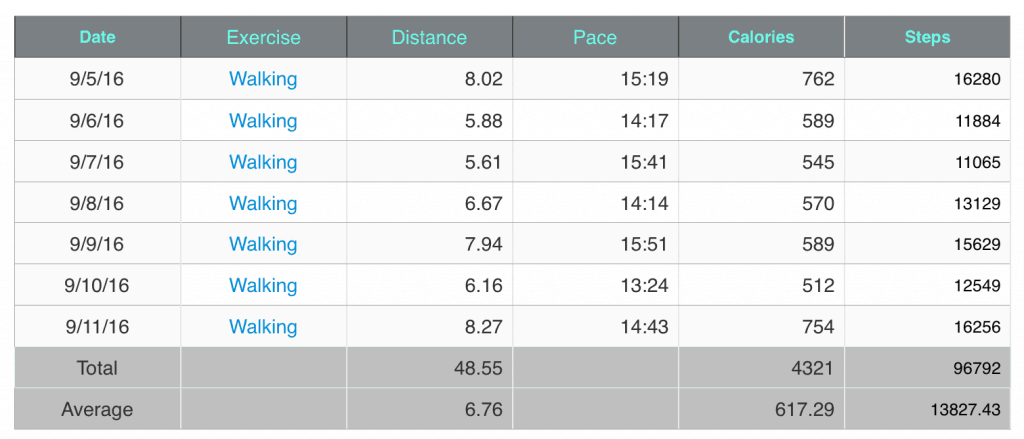
Figure 1: Runtatsic Distance with Steps: Above is the data from the Runtastic Dashboard with steps added. Source is iPhone GPS.
During the sixth week, I had a decent week of exercise. I walked a total of 48.6 miles and averaged 6.76 miles per day. It was not quite as good as last week. I did not take a day off which makes three weeks of straight exercise. I did continue with 3 sets of push up and setups every other day with 20-40 of them per set.

Figure 2: FitBit Steps for Week Six: Above is a depiction of the steps from the Fitbit Dashboard. The Fitbit surge is the source.
The above image is the 7 day graph of the steps for week six. I walked 96,861 steps foe an average of 13,508 steps per day.

Figure 3: Runtastic Distance Graph: The above graph is a depiction of the distance from the Runtastic Dashboard. Source is iPhone GPS.
I burned 4560 Calories this week. That is over 1.1 pounds lost for the week just through exercise. My calculations and the fit bit agree with this measurement.

Figure 4: Fitbit Distance for Week Six: Above is a graph of the distance out of the Fitbit dashboard. I use a Fitbit Surge is the source.
My best day for exercise was Sunday. I did 47.5 miles this week and averages 6.6 miles per day.

Figure 5: Fitbit Active Minutes for Week Six: This graph shows the active minutes per each day of the sixth week.
I had 671 active minutes for the six week and averaged 86 minutes a day.

Figure 6: Fitbit Activity Calories for Sixth Week: This a graphical representation of the number of activity calories each day during the Sixth week.
I consumed approximately 1800 calories per day and burned 3400. That means about 1/2 pound per day lost. This would be 3.5 pounds lost in a week.
Weight:

Figure 7: Fitbit Dashboard Weight For Week: This a graphical representation of the weight progression over the past 7 days.
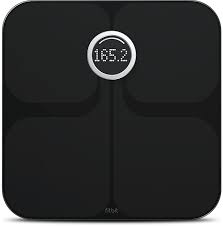
Clearly, the Fitbit and my actual weight do not agree this week. The Fitbit said I should have lost approximately 3.5 pounds in a week and I gained weight. The first week I have lost a total of 16 pounds in 6 weeks and an average 4 pounds a week.
Nutrition:

Figure 8: Lose-it Macronutrient Intake: A graphical representation of the macronutrient intake for the last 7-14 days.
I averaged about 1300-2220 calories which is a deficit on the average of 800 calories a day or 5600 calories a week. That is just under 1.5 pounds on weight loss from my diet.So how did I complete week three successfully. I continued to take in 30-45 grams of fiber and averaged 100-128 ounces of water. I maintained about 1400-1800 calorie per day. I reduce my candy intake this week but I could use more protein.

Figure 9: Lose-it Macronutient Intake Summary: This graph is a graph that show the percentage macronutrient intake by meal.
The above graph shows an intake in protein of 18.5%. Clearly I could use more protein in my diet.
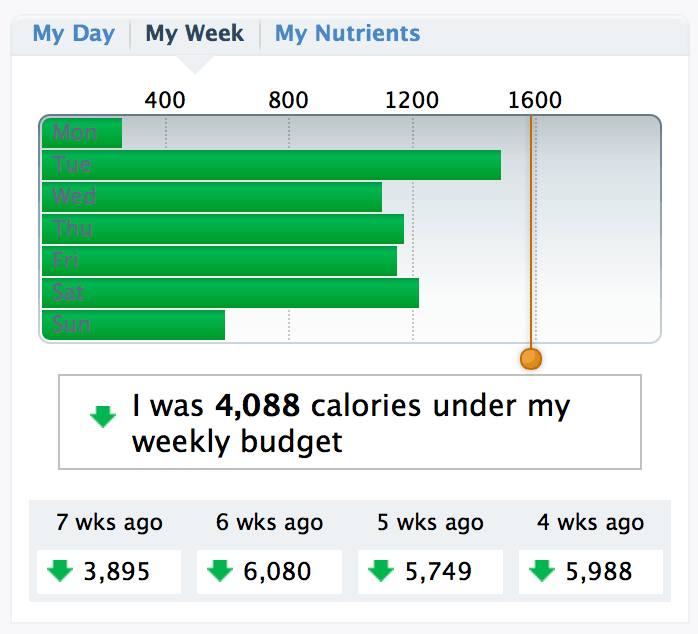
Figure 10: Lose-it Daily Calorie Intake with deficit: This graph shows the five intake for the last 7 days.
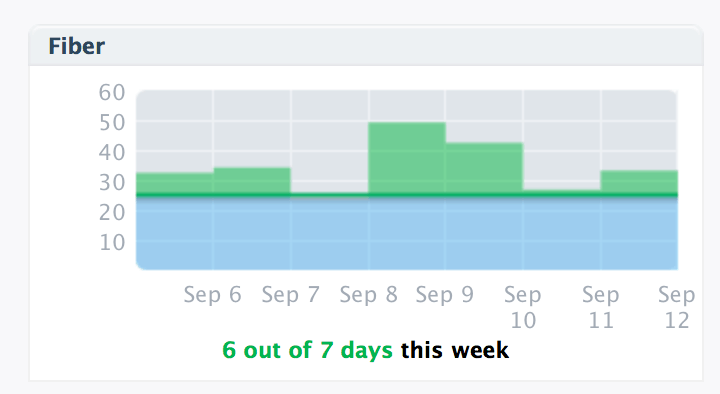
My fiber consumption was 20-50 grams per day this week. I can tell a difference if I have less fiber. I am considerably more hungry.
As I mentioned above, I did plateau this week and will have to step up my exercise this week to start losing again. This happens as your weight drops and so does your calorie requirements. I will either need to burn more or eat less.



Be the first to comment on "Progress Report: 6 Weeks"